Cryptocurrency trading has grown from a niche hobby into a global financial phenomenon. With thousands of digital assets available and markets operating 24/7, traders need reliable tools to make informed decisions. One of the most effective methods for understanding market behavior is technical analysis (TA).
Technical analysis helps traders predict future price movements by studying past market data, primarily price and volume. Unlike fundamental analysis, which focuses on a project’s technology or team, technical analysis focuses on market psychology and price patterns. This guide explains the basics of technical analysis for crypto traders, covering essential tools, indicators, and strategies to help beginners trade more confidently.
What Is Technical Analysis?
Technical analysis is the study of historical price data to forecast future price movements. It assumes that all relevant information is already reflected in the price and that market trends tend to repeat over time.
Key Principles of Technical Analysis
- Price Discounts Everything: All known information, news, fundamentals, and sentiment are already included in the current price.
- Prices Move in Trends: Markets move in identifiable trends (up, down, or sideways) that can be analyzed and traded.
- History Repeats Itself: Market behavior often follows recurring patterns due to human psychology.
In crypto trading, technical analysis is especially useful because the market is highly volatile and driven by trader sentiment rather than traditional financial metrics.
Why Technical Analysis Matters in Crypto

Cryptocurrency markets differ from traditional markets in several ways: they are open 24/7, highly volatile, and influenced by global sentiment. Technical analysis helps traders navigate these conditions by providing a structured approach to decision-making.
Benefits of Technical Analysis
- Identifies Entry and Exit Points: Helps traders decide when to buy or sell.
- Manages Risk: Supports stop-loss and take-profit planning.
- Removes Emotion: Encourages data-driven decisions instead of emotional reactions.
- Works Across Timeframes: Useful for day traders, swing traders, and long-term investors.
Understanding Price Charts
Price charts are the foundation of technical analysis. They visually represent how an asset’s price changes over time.
1. Line Chart
A simple chart that connects closing prices over a specific period. It’s easy to read but lacks detailed information about price fluctuations within each period.
2. Bar Chart
Displays the open, high, low, and close (OHLC) prices for each time interval. It provides more detail than a line chart.
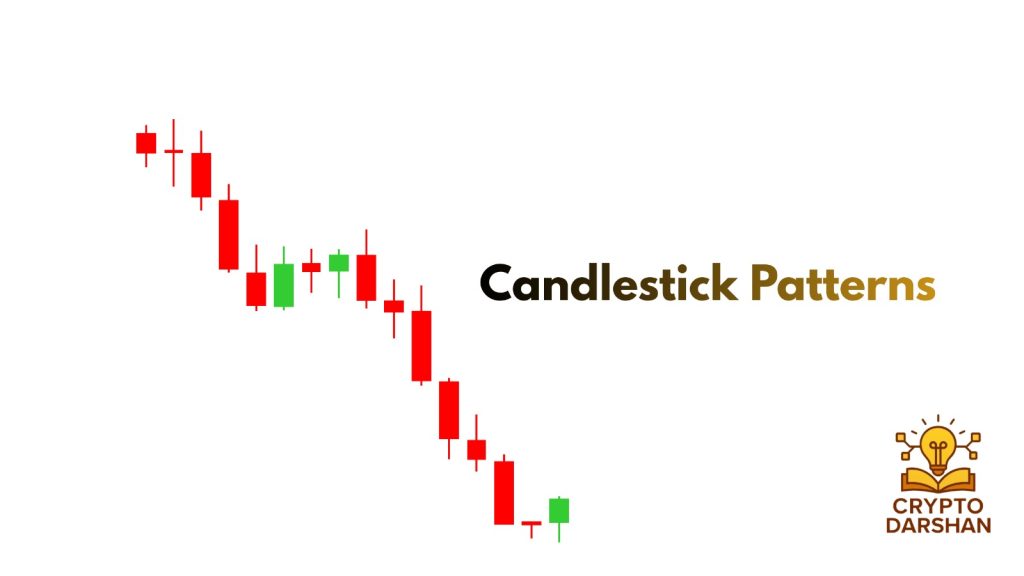
3. Candlestick Chart
The most popular chart type among crypto traders. Each candlestick shows the open, high, low, and close prices for a given period.
- Green (or white) candles indicate price increases.
- Red (or black) candles indicate price decreases.
Candlestick patterns reveal market sentiment and potential reversals, making them essential for technical analysis.
Understanding Market Trends
In cryptocurrency trading, understanding market trends is one of the most important skills a trader can develop. A trend represents the general direction in which the price of an asset is moving over a specific period. Recognizing whether the market is trending upward, downward, or sideways helps traders make smarter decisions about when to buy, sell, or hold.
Unlike random price movements, trends often reflect the collective psychology of market participants optimism, fear, greed, or uncertainty. By identifying these patterns early, traders can align their strategies with the market’s momentum instead of fighting against it.
Since many traders use decentralized exchanges, understanding chart patterns becomes crucial when trading on platforms listed in Best DEX 2026.
What Is a Market Trend?
A market trend is the sustained movement of an asset’s price in one direction over time. It can last for minutes, days, or even months, depending on the timeframe being analyzed.
There are three main types of trends:
- Uptrend (Bullish Trend): Prices consistently make higher highs and higher lows.
- Downtrend (Bearish Trend): Prices consistently make lower highs and lower lows.
- Sideways Trend (Consolidation): Prices move within a range, showing no clear direction.
1. Uptrend (Bullish Market)
An uptrend occurs when buyers dominate the market, pushing prices higher over time. Each successive peak and trough is higher than the previous one.
Characteristics:
- Higher highs and higher lows.
- Strong buying volume.
- Positive market sentiment and optimism.
Trading Strategy:
- Look for buying opportunities during pullbacks (temporary dips).
- Use trendlines or moving averages to identify support zones.
- Avoid shorting unless there are clear reversal signals.
Example:
If Bitcoin rises from $25,000 to $30,000, then dips to $28,000 before climbing to $35,000, it’s forming an uptrend with higher highs and higher lows.
2. Downtrend (Bearish Market)
A downtrend happens when sellers control the market, causing prices to fall over time. Each peak and trough is lower than the previous one.
Characteristics:
- Lower highs and lower lows.
- Increasing selling pressure.
- Negative sentiment and fear dominate the market.
Trading Strategy:
- Look for short-selling opportunities during rallies (temporary price increases).
- Use resistance levels to identify potential entry points for short trades.
- Avoid buying until a clear reversal pattern appears.
Example:
If Ethereum drops from $2,000 to $1,800, then rebounds to $1,900 before falling again to $1,600, it’s in a downtrend lower highs and lower lows.
3. Sideways Trend (Consolidation Phase)
A sideways trend occurs when prices move within a narrow range, showing no clear upward or downward direction. This phase often represents market indecision or preparation for a major breakout.
Characteristics:
- Price fluctuates between support and resistance levels.
- Low volatility and reduced trading volume.
- Traders wait for a breakout to confirm the next trend.
Trading Strategy:
- Trade within the range buy near support and sell near resistance.
- Wait for a confirmed breakout before entering large positions.
- Use volume indicators to confirm breakout strength.
Example:
If a coin trades between $1.00 and $1.20 for several weeks, it’s in a sideways trend. A breakout above $1.20 could signal a new uptrend.
Identifying Trends Using Tools

Traders use several tools and indicators to identify and confirm market trends.
1. Trendlines
A trendline is a straight line drawn across price points to show the direction of the trend.
- Uptrend Line: Connects higher lows.
- Downtrend Line: Connects lower highs.
When price breaks a trendline, it may signal a potential trend reversal.
2. Moving Averages (MA)
Moving averages smooth out price data to reveal the underlying trend.
- Simple Moving Average (SMA): Average of closing prices over a set period.
- Exponential Moving Average (EMA): Gives more weight to recent prices.
Example:
If the 50-day EMA is above the 200-day EMA, it indicates a bullish trend (known as a “golden cross”).
3. Average Directional Index (ADX)
The ADX measures the strength of a trend.
- ADX above 25 = Strong trend.
- ADX below 20 = Weak or sideways market.
4. Volume Analysis
Volume confirms the strength of a trend.
- Rising volume with price increase = Strong uptrend.
- Rising volume with price decrease = Strong downtrend.
- Low volume = Weak or uncertain trend.
The Psychology Behind Market Trends
Trends are driven by collective human behavior.
- Uptrends: Fueled by optimism, greed, and FOMO (fear of missing out).
- Downtrends: Driven by fear, panic selling, and loss of confidence.
- Sideways Trends: Reflect uncertainty and indecision among traders.
Recognizing these emotional cycles helps traders anticipate potential reversals or breakouts.
Common Mistakes When Analyzing Trends
- Forcing Trends: Seeing patterns where none exist.
- Ignoring Volume: A trend without volume confirmation is weak.
- Trading Against the Trend: Trying to predict reversals too early.
- Neglecting Timeframes: Focusing on one timeframe can give misleading signals.
Support and Resistance

Support and resistance are key concepts in technical analysis.
- Support: Support is a price level where demand is strong enough to stop the price from falling further. It’s the point where buyers step in, believing the asset is undervalued, and start purchasing, which pushes the price back up
- Resistance: Resistance is the opposite of support a price level where selling pressure prevents the price from rising further. It’s the point where traders believe the asset is overvalued and start selling, causing the price to drop.
When price breaks above resistance, it often becomes new support, and vice versa.
Example:
If Bitcoin repeatedly bounces near $25,000, that level acts as support. If it breaks above $30,000 and holds, $30,000 becomes new support.
Chart Patterns
Chart patterns are visual formations that indicate potential market movements. They are divided into continuation patterns (trend continues) and reversal patterns (trend changes direction).
1. Head and Shoulders
A reversal pattern signaling a trend change.
- Head and Shoulders Top: Indicates a shift from bullish to bearish.
- Inverse Head and Shoulders: Indicates a shift from bearish to bullish.
2. Double Top and Double Bottom
- Double Top: Two peaks at similar levels, signaling a potential downtrend.
- Double Bottom: Two troughs at similar levels, signaling a potential uptrend.
3. Triangles
- Ascending Triangle: Bullish continuation pattern.
- Descending Triangle: Bearish continuation pattern.
- Symmetrical Triangle: Indicates consolidation before a breakout.
4. Flags and Pennants
Short-term continuation patterns that appear after strong price moves.
5. Cup and Handle
A bullish pattern resembling a cup followed by a small consolidation (the handle) before a breakout.
Bitcoin price structure often dictates overall market trends, making chart analysis critical as discussed in Bitcoin Investment Strategy: Maximize Returns 2026.
Candlestick Patterns
Candlestick charts are a technical tool that packs data for multiple time frames into single price bars. This makes them more useful than traditional open, high, low, and close (OHLC) bars or simple lines that connect the dots of closing prices..
1. Hammer
- Appearance: Small body with a long lower wick and little or no upper wick.
- Meaning: Appears after a downtrend, signaling a potential reversal as buyers push prices back up.
- Example: Bitcoin drops for several days, forms a hammer, and then starts rising a bullish reversal signal.
2. Bullish Engulfing
- Appearance: A large green candle completely engulfs the previous red candle.
- Meaning: Buyers have taken control, often marking the start of an uptrend.
- Tip: Stronger when it appears after a prolonged downtrend.
3. Morning Star
- Appearance: A three-candle pattern a long red candle, a small indecisive candle (Doji or small body), and a large green candle.
- Meaning: Indicates a shift from selling pressure to buying momentum.
4. Piercing Pattern
- Appearance: A red candle followed by a green candle that opens lower but closes above the midpoint of the previous red candle.
- Meaning: Suggests buyers are regaining control after a downtrend.
5. Three White Soldiers
- Appearance: Three consecutive long green candles with small wicks.
- Meaning: Strong bullish momentum and potential trend reversal from bearish to bullish.
Bearish Candlestick Patterns

These patterns indicate that sellers are taking control and prices may fall.
1. Shooting Star
- Appearance: Small body with a long upper wick and little or no lower wick.
- Meaning: Appears after an uptrend, signaling a potential reversal as buyers fail to sustain higher prices.
2. Bearish Engulfing
- Appearance: A large red candle completely engulfs the previous green candle.
- Meaning: Sellers overpower buyers, often marking the start of a downtrend.
3. Evening Star
- Appearance: A three-candle pattern a long green candle, a small indecisive candle, and a large red candle.
- Meaning: Indicates a shift from bullish to bearish sentiment.
4. Dark Cloud Cover
- Appearance: A green candle followed by a red candle that opens higher but closes below the midpoint of the previous green candle.
- Meaning: Suggests a potential bearish reversal.
5. Three Black Crows
- Appearance: Three consecutive long red candles with small wicks.
- Meaning: Strong bearish momentum and possible continuation of a downtrend.
Key Technical Indicators
Indicators are mathematical calculations based on price and volume data. They help confirm trends and identify potential entry or exit points.
1. Moving Averages (MA)
Smooth out price data to identify trends.
- Simple Moving Average (SMA): Average of closing prices over a set period.
- Exponential Moving Average (EMA): Gives more weight to recent prices.
Usage:
- When price crosses above the MA, it signals a potential uptrend.
- When price crosses below, it signals a potential downtrend.
2. Relative Strength Index (RSI)
Measures momentum and identifies overbought or oversold conditions.
- RSI above 70 = Overbought (possible sell signal).
- RSI below 30 = Oversold (possible buy signal).
3. Moving Average Convergence Divergence (MACD)
Shows the relationship between two EMAs.
- MACD Line crossing above Signal Line: Bullish signal.
- MACD Line crossing below Signal Line: Bearish signal.
4. Bollinger Bands
Consist of a moving average with upper and lower bands that expand or contract based on volatility.
- Price touching the upper band = Overbought.
- Price touching the lower band = Oversold.
5. Volume Indicators
Volume confirms the strength of a trend.
- Rising volume with price increase = Strong uptrend.
- Falling volume with price increase = Weak trend.
6. Fibonacci Retracement
Used to identify potential support and resistance levels based on key Fibonacci ratios (23.6%, 38.2%, 50%, 61.8%).
Combining Indicators for Better Accuracy
No single indicator is perfect. Successful traders combine multiple indicators to confirm signals.
Example Strategy:
- Use Moving Averages to identify trend direction.
- Use RSI to check if the asset is overbought or oversold.
- Use Volume to confirm the strength of the move.
This multi-layered approach reduces false signals and improves decision-making.
Timeframes in Technical Analysis
In technical analysis, timeframes refer to the duration each candlestick or bar represents on a chart for example, 1 minute, 1 hour, 1 day, or 1 week. Choosing the right timeframe is crucial because it determines how you interpret market trends, volatility, and trading opportunities.
Different traders use different timeframes depending on their goals, risk tolerance, and trading style. The four main categories are scalping, day trading, swing trading, and long-term investing. Each has its own approach, advantages, and challenges.
1. Scalpers (1-Minute to 15-Minute Charts)
Overview:
Scalping is the fastest trading style. Scalpers aim to profit from very small price movements that occur within minutes. They open and close multiple trades throughout the day, often holding positions for only seconds or minutes.
Key Characteristics:
- Focus on short-term volatility and quick profits.
- Use lower timeframes like 1-minute, 5-minute, or 15-minute charts.
- Rely heavily on technical indicators such as Moving Averages, RSI, and Bollinger Bands.
- Require constant attention and fast execution.
Best For:
Experienced traders who can make quick decisions and manage risk effectively in fast-moving markets.
2. Day Traders (30-Minute to 4-Hour Charts)
Overview:
Day traders open and close all their positions within the same day. They avoid overnight risk and focus on capturing intraday price movements.
Key Characteristics:
- Use 30-minute, 1-hour, or 4-hour charts to identify setups.
- Rely on technical indicators like MACD, RSI, and volume analysis.
- Often trade around key events or news that cause short-term volatility.
- Aim for moderate profits from multiple trades per day.
Best For:
Traders who can dedicate time each day to analyze charts and execute trades but prefer not to hold positions overnight.
3. Swing Traders (Daily to Weekly Charts)
Overview:
Swing traders hold positions for several days or weeks, aiming to profit from medium-term price swings. They focus on identifying trends and reversals rather than short-term fluctuations.
Key Characteristics:
- Use daily and weekly charts to spot trend changes.
- Combine technical indicators (like Moving Averages, Fibonacci Retracements, and RSI) with chart patterns (like triangles or head and shoulders).
- Less affected by intraday noise and volatility.
- Require patience and a clear strategy for entry and exit points.
Best For:
Traders who prefer a balanced approach, not too fast-paced but still active enough to take advantage of medium-term market movements.
4. Long-Term Investors (Weekly to Monthly Charts)
Overview:
Long-term investors, often called position traders, hold assets for months or even years. They focus on the overall market trend rather than short-term fluctuations.
Key Characteristics:
- Use weekly or monthly charts to identify major trends.
- Rely on both technical and fundamental analysis.
- Focus on macroeconomic factors, project fundamentals, and long-term growth potential.
- Less concerned with daily volatility.
Best For:
Investors who believe in the long-term potential of cryptocurrencies and prefer a hands-off approach.
Risk Management in Technical Trading
Even the best analysis can fail. Risk management ensures that losses remain manageable.
Key Principles
- Use Stop-Loss Orders: Automatically close losing trades at a set level.
- Set Take-Profit Targets: Lock in profits when price reaches a goal.
- Position Sizing: Never risk more than 1–2% of total capital on a single trade.
- Diversification: Avoid putting all funds into one asset.
Proper risk management protects traders from emotional decisions and large losses.
Common Mistakes Beginners Make

- Overusing Indicators: Too many indicators can cause confusion.
- Ignoring Risk Management: Focusing only on profits leads to big losses.
- Trading Without a Plan: Successful trading requires a clear strategy.
- Chasing Hype: Following social media trends often ends in losses.
- Emotional Trading: Fear and greed can override logic.
Steps to Build a Strategy
- Define Goals: Decide whether to trade short-term or long-term.
- Choose Indicators: Select 2–3 reliable tools.
- Backtest: Test the strategy on historical data.
- Set Rules: Define entry, exit, and risk management criteria.
- Review and Adjust: Continuously refine based on performance.
The Role of Psychology in Technical Analysis

Market movements are driven by human emotions, fear, greed, and hope. Technical analysis reflects these emotions through price patterns. Understanding market psychology helps traders anticipate reactions to news, volatility, and price levels.
Example:
When prices rise rapidly, FOMO (fear of missing out) drives more buyers, pushing prices higher until a correction occurs.
Tools and Platforms for Technical Analysis
Several platforms provide advanced charting tools for crypto traders:
- TradingView: Offers customizable charts and community scripts.
- CoinMarketCap & CoinGecko: Provide basic charts and market data.
- Binance & Bybit: Include built-in technical indicators for live trading.
These tools allow traders to analyze multiple assets and apply indicators easily.
The Limitations of Technical Analysis
While powerful, technical analysis is not foolproof.
Limitations:
- It cannot predict unexpected news or events.
- False signals can occur in volatile markets.
- It works best when combined with fundamental analysis.
Traders should use TA as a guide, not a guarantee.
Conclusion
Technical analysis is an essential skill for crypto traders. It helps identify trends, manage risk, and make informed decisions in a volatile market. By understanding charts, indicators, and patterns, beginners can develop disciplined trading strategies and avoid emotional mistakes.
However, technical analysis is not about predicting the future it’s about improving probabilities. Combining TA with sound risk management and continuous learning is the key to long-term success in crypto trading.