The world of cryptocurrency trading can seem complex at first. Prices move quickly, charts look confusing, and patterns appear mysterious. However, one of the most powerful tools for understanding price movements is the Candlestick Chart. This chart type is used by traders around the world to analyze market trends, predict price movements, and make informed trading decisions.
A Candlestick Chart is a visual representation of price data over a specific time period. Each “candlestick” shows how the price of a cryptocurrency moved during that time. By learning how to read these charts, beginners can gain valuable insights into market behavior and improve their trading strategies.
This guide explains everything a beginner needs to know about reading a Candlestick Chart—from understanding its structure to recognizing patterns and using them for trading decisions.
What Is a Candlestick Chart?
A Candlestick Chart is a type of financial chart that shows price movements for an asset, such as Bitcoin or Ethereum, over time. It originated in Japan in the 18th century, where rice traders used it to track prices and market emotions. Today, it’s one of the most popular tools in technical analysis.
Each candlestick represents a specific time frame—such as one minute, one hour, one day, or one week, and shows four key pieces of information:
- Open Price – The price at which the asset started trading during that time.
- Close Price – The price at which the asset finished trading during that time.
- High Price – The highest price reached during that time.
- Low Price – The lowest price reached during that time.
These four data points are displayed in a single candlestick, making it easy to see how the price moved during that period.
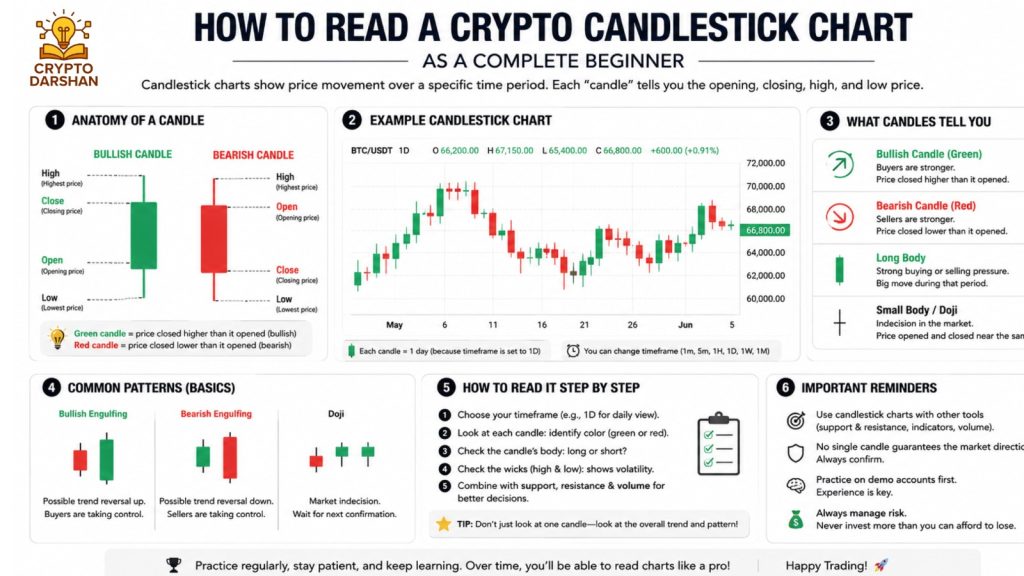
The Structure of a Candlestick
Each candlestick has three main parts:
- The Body – The thick part of the candlestick that shows the range between the opening and closing prices.
- The Wick (or Shadow) – The thin lines above and below the body that show the highest and lowest prices.
- The Color – Indicates whether the price went up or down during that period.
- A green (or white) candlestick means the closing price was higher than the opening price (bullish).
- A red (or black) candlestick means the closing price was lower than the opening price (bearish).
For example, if Bitcoin opened at $30,000 and closed at $31,000, the candlestick would be green, showing a price increase. If it opened at $31,000 and closed at $30,000, it would be red, showing a price decrease.
How to Read a Single Candlestick
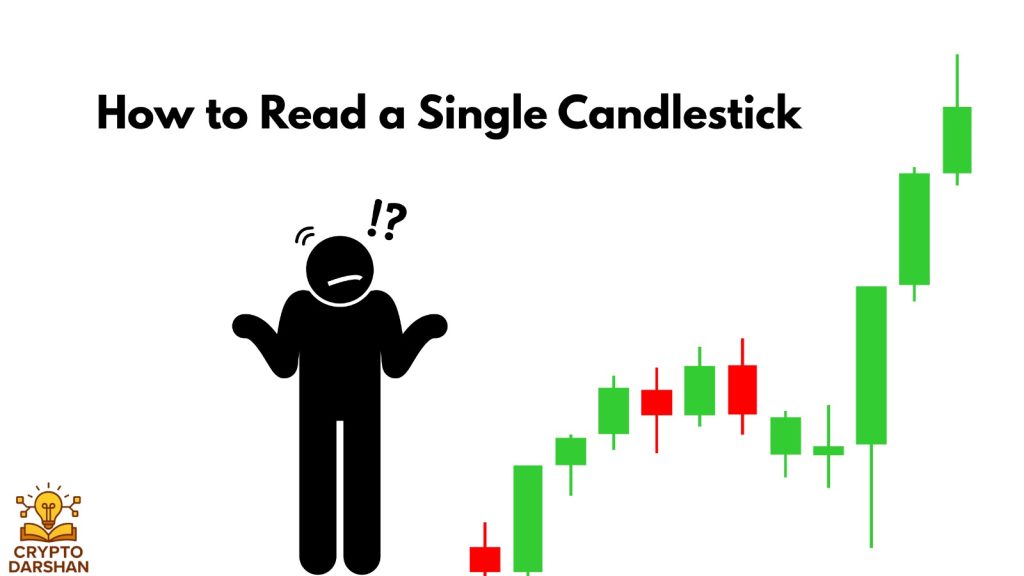
To read a single candlestick, focus on its body and wicks:
- Long Body – Indicates strong buying or selling pressure.
- Short Body – Suggests little price movement or indecision.
- Long Upper Wick – Shows that buyers pushed prices up, but sellers brought them back down.
- Long Lower Wick – Shows that sellers pushed prices down, but buyers brought them back up.
By analyzing these features, traders can understand the market sentiment during that time frame.
Knowing how to read candlestick charts can help you identify suspicious price movements before they become full-blown market manipulation. Learn more in What Causes a Crypto Pump and Dump and How to Spot One.
Time Frames in a Candlestick Chart
A Candlestick Chart can display data for different time frames. Each candlestick represents one unit of time, depending on the chart setting. Common time frames include:
- 1-Minute Chart – Each candlestick shows one minute of trading.
- 5-Minute Chart – Each candlestick shows five minutes of trading.
- 1-Hour Chart – Each candlestick shows one hour of trading.
- 1-Day Chart – Each candlestick shows one day of trading.
- 1-Week Chart – Each candlestick shows one week of trading.
Shorter time frames are used by day traders who want to make quick trades, while longer time frames are used by swing traders and investors who focus on long-term trends.
Understanding Bullish and Bearish Candlesticks
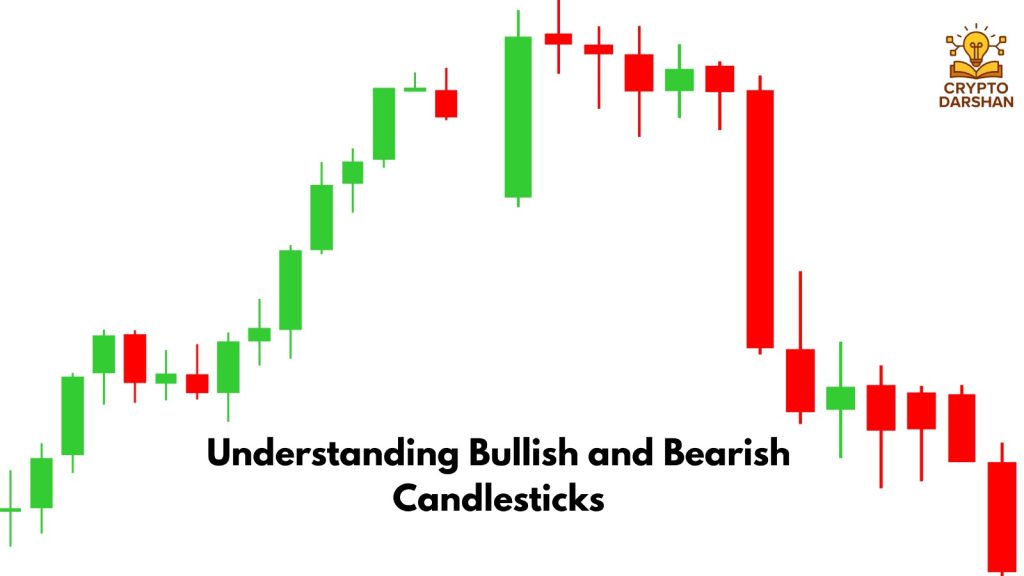
A Candlestick Chart helps traders identify whether the market is bullish (rising) or bearish (falling).
Bullish Candlestick
- The closing price is higher than the opening price.
- The candlestick is usually green or white.
- Indicates that buyers were in control during that period.
Bearish Candlestick
- The closing price is lower than the opening price.
- The candlestick is usually red or black.
- Indicates that sellers were in control during that period.
By comparing bullish and bearish candlesticks, traders can see how market sentiment changes over time.
Reading Multiple Candlesticks Together
While a single candlestick provides useful information, the real power of a Candlestick Chart comes from analyzing multiple candlesticks together. Patterns formed by two or more candlesticks can reveal potential reversals or continuations in price trends.
For example:
- A series of green candlesticks may indicate a strong uptrend.
- A series of red candlesticks may indicate a downtrend.
- Alternating colors may show market indecision or consolidation.
Recognizing these patterns helps traders anticipate future price movements.
Common Candlestick Patterns for Beginners
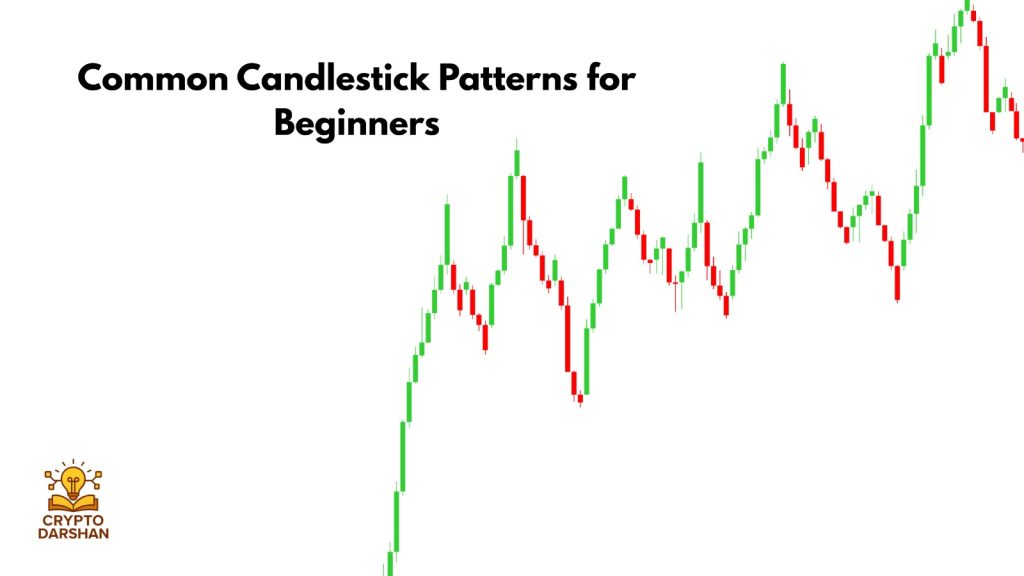
1. Doji
A Doji forms when the opening and closing prices are almost the same. It looks like a cross or plus sign. This pattern shows indecision in the market—neither buyers nor sellers are in control. A Doji often appears before a trend reversal.
2. Hammer
A Hammer has a small body and a long lower wick. It appears after a downtrend and signals a potential reversal. The long lower wick shows that sellers pushed prices down, but buyers regained control.
3. Inverted Hammer
An Inverted Hammer has a small body and a long upper wick. It also appears after a downtrend and suggests that buyers are starting to gain strength.
4. Shooting Star
A Shooting Star looks like an inverted hammer but appears after an uptrend. It signals that the uptrend may be losing momentum and a reversal could occur.
5. Bullish Engulfing
A Bullish Engulfing pattern occurs when a small red candlestick is followed by a larger green candlestick that completely covers it. This pattern indicates strong buying pressure and a potential upward reversal.
6. Bearish Engulfing
A Bearish Engulfing pattern occurs when a small green candlestick is followed by a larger red candlestick that engulfs it. This signals strong selling pressure and a possible downward reversal.
7. Morning Star
A Morning Star is a three-candlestick pattern that appears after a downtrend. It consists of a long red candlestick, a small-bodied candlestick (indecision), and a long green candlestick. It signals a bullish reversal.
8. Evening Star
An Evening Star is the opposite of the Morning Star. It appears after an uptrend and signals a bearish reversal.
9. Spinning Top
A Spinning Top has a small body and long wicks on both sides. It shows indecision and often appears before a change in trend.
10. Marubozu
A Marubozu has no wicks—just a solid body. A green Marubozu shows strong buying pressure, while a red one shows strong selling pressure.
These patterns are the foundation of Candlestick Chart analysis and help traders make better decisions.
How to Identify Trends Using a Candlestick Chart
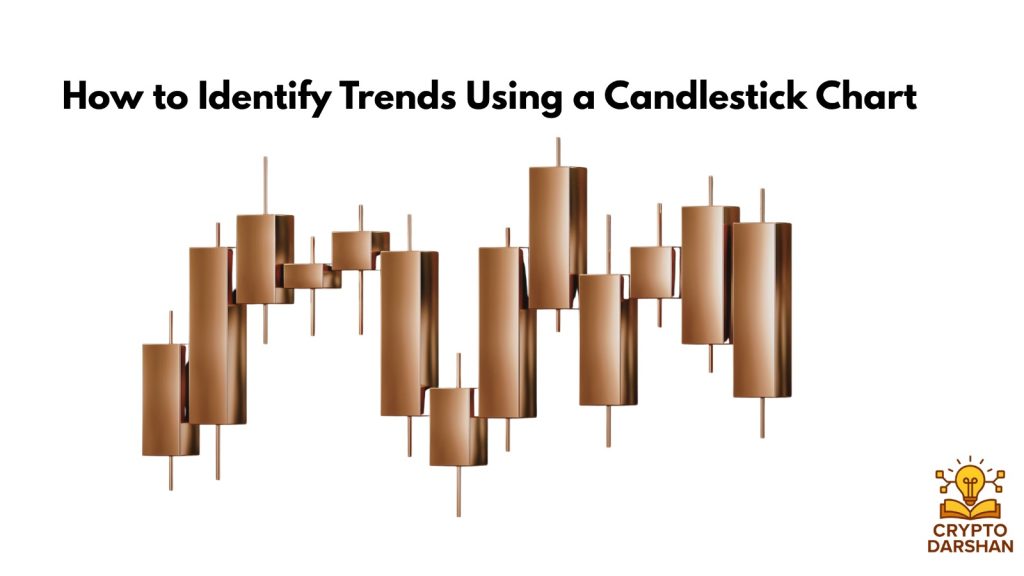
Trends are the direction in which prices move over time. A Candlestick Chart helps traders identify three main types of trends:
- Uptrend – A series of higher highs and higher lows. Indicates that buyers are in control.
- Downtrend – A series of lower highs and lower lows. Indicates that sellers are in control.
- Sideways Trend – Prices move within a range. Indicates market indecision.
By identifying trends early, traders can align their strategies with the market direction.
Reading price charts is an essential skill during prolonged market downturns. Check out What Is Crypto Winter? How to Survive When the Market Crashes to understand how investors navigate bearish conditions.
Support and Resistance Levels
Support and resistance are key concepts in Candlestick Chart analysis.
- Support is a price level where buying pressure is strong enough to prevent prices from falling further.
- Resistance is a price level where selling pressure prevents prices from rising further.
Candlestick patterns often form near these levels, signaling potential breakouts or reversals. For example, a bullish engulfing pattern near a support level may indicate a strong buying opportunity.
Volume and Candlestick Charts
Volume shows how much of a cryptocurrency was traded during a specific period. When combined with a Candlestick Chart, volume helps confirm the strength of price movements.
- High Volume – Confirms strong buying or selling pressure.
- Low Volume – Suggests weak market participation or indecision.
For example, a bullish candlestick with high volume indicates strong buying interest, while a bearish candlestick with high volume shows strong selling pressure.
Using Moving Averages with Candlestick Charts
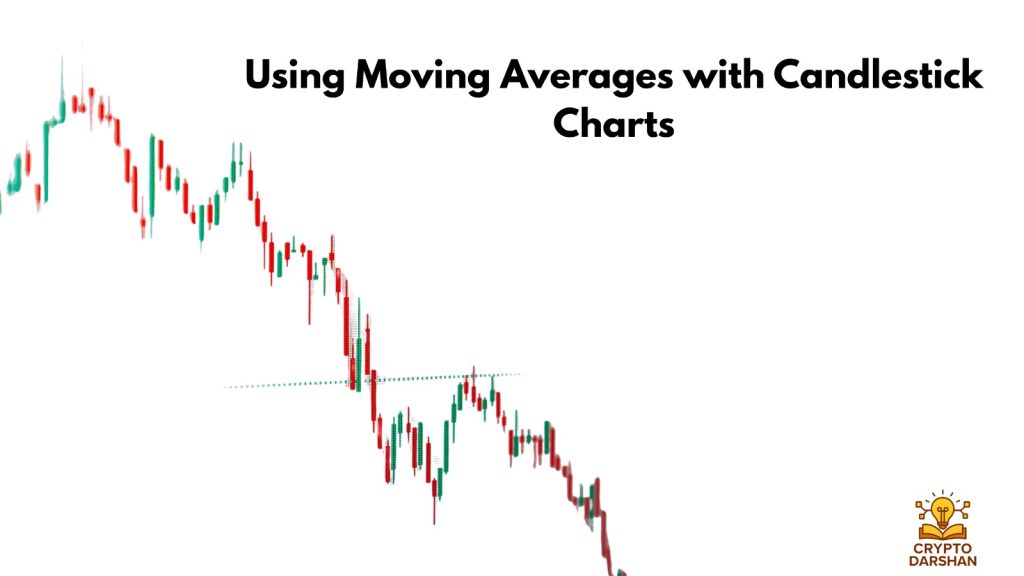
Moving averages are commonly used with Candlestick Charts to identify trends and potential entry or exit points.
- Simple Moving Average (SMA) – The average price over a specific number of periods.
- Exponential Moving Average (EMA) – Gives more weight to recent prices.
When the price is above the moving average, it indicates an uptrend. When it’s below, it indicates a downtrend. Combining moving averages with candlestick patterns provides stronger trading signals.
Combining Candlestick Patterns with Indicators
To improve accuracy, traders often combine Candlestick Chart analysis with technical indicators such as:
- Relative Strength Index (RSI) – Measures overbought or oversold conditions.
- MACD (Moving Average Convergence Divergence) – Shows momentum and trend direction.
- Bollinger Bands – Indicate volatility and potential breakout points.
For example, a bullish candlestick pattern combined with an RSI below 30 (oversold) can signal a strong buying opportunity.
How to Avoid False Signals
Not every candlestick pattern leads to a trend reversal or continuation. To avoid false signals:
- Confirm patterns with volume.
- Check for patterns near support or resistance levels.
- Use multiple time frames for confirmation.
- Combine candlestick analysis with other indicators.
By following these steps, traders can reduce the risk of making decisions based on misleading signals.
Practical Steps to Read a Candlestick Chart
- Choose a Time Frame – Select a time frame that matches the trading style (short-term or long-term).
- Identify the Trend – Look for a series of higher highs or lower lows.
- Spot Key Patterns – Recognize common candlestick formations.
- Check Volume – Confirm the strength of the pattern.
- Mark Support and Resistance – Identify key price levels.
- Plan Entry and Exit Points – Use patterns and indicators to decide when to buy or sell.
Following these steps helps beginners read a Candlestick Chart with confidence.
Example: Reading a Bitcoin Candlestick Chart
Imagine a daily Candlestick Chart for Bitcoin:
- The chart shows a series of green candlesticks, indicating an uptrend.
- A Doji appears at the top, showing indecision.
- The next day, a red candlestick forms, confirming a potential reversal.
- Volume increases, supporting the bearish signal.
In this case, the Doji and red candlestick together suggest that the uptrend may be ending, and a downtrend could begin.
Common Mistakes Beginners Make
- Ignoring Context – A pattern’s meaning depends on where it appears in the trend.
- Overtrading – Acting on every pattern without confirmation.
- Neglecting Volume – Ignoring volume can lead to false interpretations.
- Using Only One Indicator – Relying solely on candlestick patterns without other tools.
- Emotional Trading – Making decisions based on fear or greed instead of analysis.
Avoiding these mistakes helps beginners use Candlestick Charts more effectively.
Advanced Candlestick Chart Techniques
Once comfortable with basic patterns, traders can explore advanced techniques:
- Multiple Time Frame Analysis – Checking patterns across different time frames for confirmation.
- Pattern Clusters – Identifying areas where multiple patterns appear together.
- Trend Continuation Patterns – Recognizing patterns like rising three methods or falling three methods that signal ongoing trends.
These advanced methods provide deeper insights into market behavior.
The Psychology Behind Candlestick Chart
A Candlestick Chart reflects the emotions of market participants—fear, greed, hope, and uncertainty. Each candlestick tells a story about how buyers and sellers interacted during that time.
- Long Green Candlestick – Shows strong optimism and buying pressure.
- Long Red Candlestick – Shows fear and selling pressure.
- Doji – Reflects indecision and balance between buyers and sellers.
Understanding this psychology helps traders interpret patterns more accurately.
Tools for Analyzing Candlestick Charts
Several platforms provide tools for analyzing Candlestick Charts, including:
- TradingView
- Binance
- Coinbase Advanced
- KuCoin
- Bybit
These platforms allow users to customize time frames, add indicators, and draw trend lines for better analysis.
How to Practice Reading Candlestick Charts
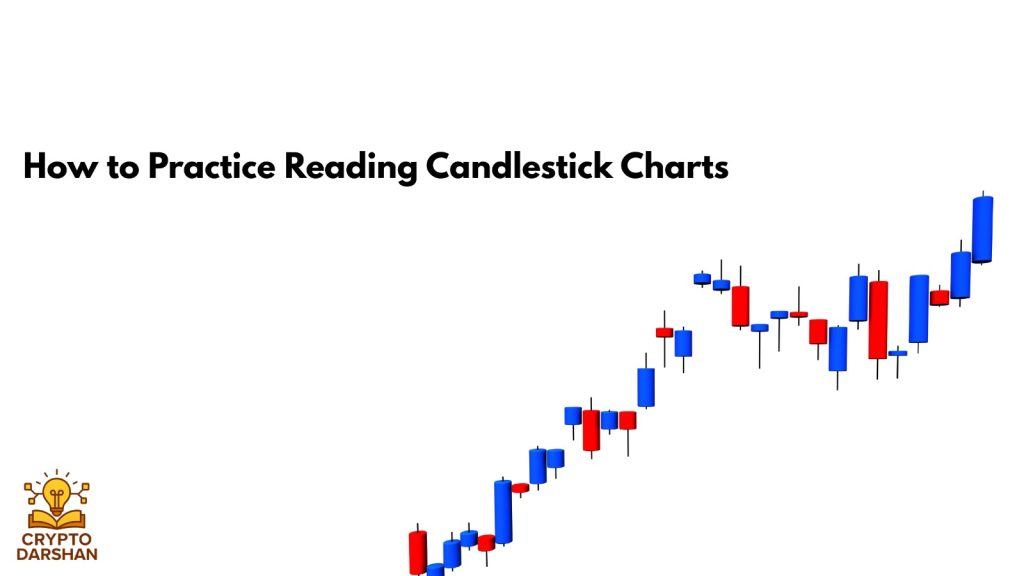
- Start with Historical Data – Review past charts to identify patterns.
- Use Demo Accounts – Practice trading without risking real money.
- Keep a Trading Journal – Record observations and results.
- Analyze Daily Charts – Spend time each day studying candlestick formations.
Consistent practice helps beginners become more confident in reading Candlestick Charts.
The Importance of Patience and Discipline
Reading a Candlestick Chart is not about predicting the future perfectly. It’s about understanding probabilities and making informed decisions. Successful traders use patience and discipline to wait for clear signals before entering or exiting trades.
Avoid rushing into trades based on emotions. Instead, rely on analysis, confirmation, and a solid trading plan.
The Role of Candlestick Charts in Crypto Trading
In cryptocurrency trading, Candlestick Charts are essential for analyzing volatile price movements. They help traders:
- Identify entry and exit points.
- Understand market sentiment.
- Spot potential reversals or continuations.
- Manage risk effectively.
Because crypto markets operate 24/7, Candlestick Charts provide real-time insights that help traders stay ahead of market changes.
Combining Fundamental and Technical Analysis
While Candlestick Charts are part of technical analysis, combining them with fundamental analysis gives a complete view of the market. Fundamental analysis looks at factors like project updates, regulations, and market news. When both analyses align, trading decisions become stronger.
For example, if a bullish candlestick pattern appears after positive news about a cryptocurrency, it may confirm a strong buying opportunity.
Risk Management with Candlestick Charts

Risk management is crucial in trading. Candlestick Charts help traders set stop-loss and take-profit levels based on patterns and support/resistance zones.
- Stop-Loss – Limits potential losses if the market moves against the trade.
- Take-Profit – Locks in profits when the price reaches a target level.
By using candlestick patterns to define these levels, traders can manage risk more effectively.
The Evolution of Candlestick Chart Analysis
Over time, Candlestick Chart analysis has evolved with technology. Modern trading platforms now offer automated pattern recognition, alerts, and AI-driven insights. However, understanding the basics remains essential. Even with advanced tools, human interpretation and experience play a key role in successful trading.
Frequently Asked Questions (FAQs)
1. What is a crypto candlestick chart?
A crypto candlestick chart is a visual representation of price movements over a specific period. Each candlestick shows the opening, closing, highest, and lowest prices of a cryptocurrency during that timeframe.
2. Why are candlestick charts important in crypto trading?
Candlestick charts help traders understand market sentiment, identify trends, and spot potential buying or selling opportunities based on historical price action.
3. What do the green and red candlesticks mean?
A green candlestick typically indicates that the closing price was higher than the opening price (bullish movement), while a red candlestick shows that the closing price was lower than the opening price (bearish movement).
4. What are the main parts of a candlestick?
A candlestick consists of a body and two wicks (or shadows). The body represents the opening and closing prices, while the wicks show the highest and lowest prices reached during the selected time period.
5. Which candlestick patterns should beginners learn first?
Beginners should start with common patterns such as the Doji, Hammer, Shooting Star, Bullish Engulfing, Bearish Engulfing, and Morning Star, as these can signal potential market reversals or trend continuation.
6. What timeframe is best for reading crypto candlestick charts?
The best timeframe depends on your trading style. Day traders often use 5-minute or 15-minute charts, while swing traders prefer 4-hour or daily charts. Beginners usually find 1-hour or daily charts easier to analyze.
Conclusion
Learning how to read a Candlestick Chart is one of the most important skills for any crypto trader. It transforms complex price data into a clear visual story of market behavior. By understanding candlestick structures, patterns, and trends, beginners can make smarter trading decisions and reduce emotional mistakes.
A Candlestick Chart is more than just a tool—it’s a window into the psychology of the market. Each candle tells a story of buyers and sellers, fear and greed, and the constant battle for control. With practice and patience, anyone can master this skill and use it to navigate the fast-moving world of cryptocurrency trading.
As the crypto market continues to grow, the ability to read and interpret a Candlestick Chart will remain a valuable asset for traders at every level.