

The Wyckoff Method is a time-tested trading and analytical approach developed by Richard D. Wyckoff in the early 20th century. It focuses on understanding the relationship between supply and demand, price action, and volume to determine the intentions of large market participants, often referred to as “smart money.” This method has become a cornerstone of technical analysis and is widely used by traders to identify market cycles, accumulation, and distribution phases.
In the context of Bitcoin and other cryptocurrencies, the Wyckoff Method provides a powerful framework for analyzing price movements and predicting potential market reversals. Since Bitcoin is known for its volatility and speculative nature, applying the Wyckoff Method helps traders identify when institutional investors are accumulating or distributing their holdings, allowing for more informed trading decisions.
This comprehensive guide explores how the Wyckoff Method applies to Bitcoin, focusing on the accumulation and markup phases. It explains each phase in detail, outlines the key principles of the method, and demonstrates how traders can use it to anticipate market trends.
Understanding Wyckoff Method

The Wyckoff Method is a comprehensive approach to understanding market behavior through the lens of supply and demand, price action, and volume. Developed by Richard D. Wyckoff in the early 1900s, this method remains one of the most respected frameworks in technical analysis. It helps traders and investors identify the intentions of large market participants, often referred to as the “Composite Man”—and align their strategies accordingly.
The Wyckoff Method is not just a set of trading rules; it is a philosophy that teaches how markets truly operate. It focuses on reading the market’s story through price and volume rather than relying solely on indicators. This makes it especially useful for analyzing assets like Bitcoin, stocks, and commodities, where institutional activity plays a major role.
The Core Principles of the Wyckoff Method

The Wyckoff Method is built on five key principles that guide traders in understanding market behavior. These principles are timeless and can be applied to any asset, including Bitcoin.
1. The Law of Supply and Demand
The first principle of the Wyckoff Method is the Law of Supply and Demand. It states that when demand exceeds supply, prices rise, and when supply exceeds demand, prices fall. This law is the foundation of all price movements in financial markets.
In Bitcoin trading, this principle is evident when large investors begin buying Bitcoin quietly during a downtrend. As demand gradually increases while supply remains limited, the price begins to stabilize and eventually rise. Conversely, when these investors start selling into strength, supply overtakes demand, leading to a price decline.
2. The Law of Cause and Effect
The Law of Cause and Effect explains that every price movement has a cause that leads to an effect. In Wyckoff’s terms, the “cause” is the accumulation or distribution phase, and the “effect” is the subsequent markup or markdown phase.
For Bitcoin, the accumulation phase is the cause, during which smart money builds positions at low prices. The markup phase is the effect, where prices rise as the broader market recognizes the trend. Understanding this relationship helps traders anticipate future price movements based on the current market structure.
3. The Law of Effort vs. Result
The Law of Effort vs. Result compares volume (effort) with price movement (result). If there is a large volume but little price movement, it suggests absorption or distribution. Conversely, if price moves significantly with moderate volume, it indicates strong demand or supply imbalance.
In Bitcoin markets, this law helps traders identify whether a breakout is genuine or false. For example, if Bitcoin’s price rises sharply on high volume, it confirms strong buying interest. However, if the price rises on low volume, it may signal a weak rally that could reverse soon.
4. The Composite Man Concept
Wyckoff introduced the idea of the Composite Man, representing the collective actions of large institutional investors. According to this concept, the market behaves as if it were controlled by a single entity that manipulates prices to accumulate assets at low prices and distribute them at high prices.
In Bitcoin trading, the Composite Man can be seen as large institutions, whales, or funds that influence market direction. Understanding their behavior allows traders to align their strategies with the smart money rather than against it.
5. The Market Cycle
The Wyckoff Market Cycle consists of four main phases: accumulation, markup, distribution, and markdown. Each phase represents a different stage of market psychology and price behavior. Recognizing these phases helps traders identify where Bitcoin currently stands in its cycle and what to expect next.
The Wyckoff Market Cycle Explained

The Wyckoff Method divides the market into four distinct phases that repeat over time. These phases are accumulation, markup, distribution, and markdown. Each phase has unique characteristics that reflect the actions of the Composite Man and the psychology of market participants.
1. Accumulation Phase
The accumulation phase occurs after a prolonged downtrend when the market has reached a point of exhaustion. During this phase, institutional investors quietly accumulate Bitcoin at low prices while retail traders remain pessimistic.
Characteristics of the Accumulation Phase
- Price moves within a trading range, forming a base.
- Volume decreases as selling pressure subsides.
- False breakdowns (spring) may occur to shake out weak holders.
- Support and resistance levels become well-defined.
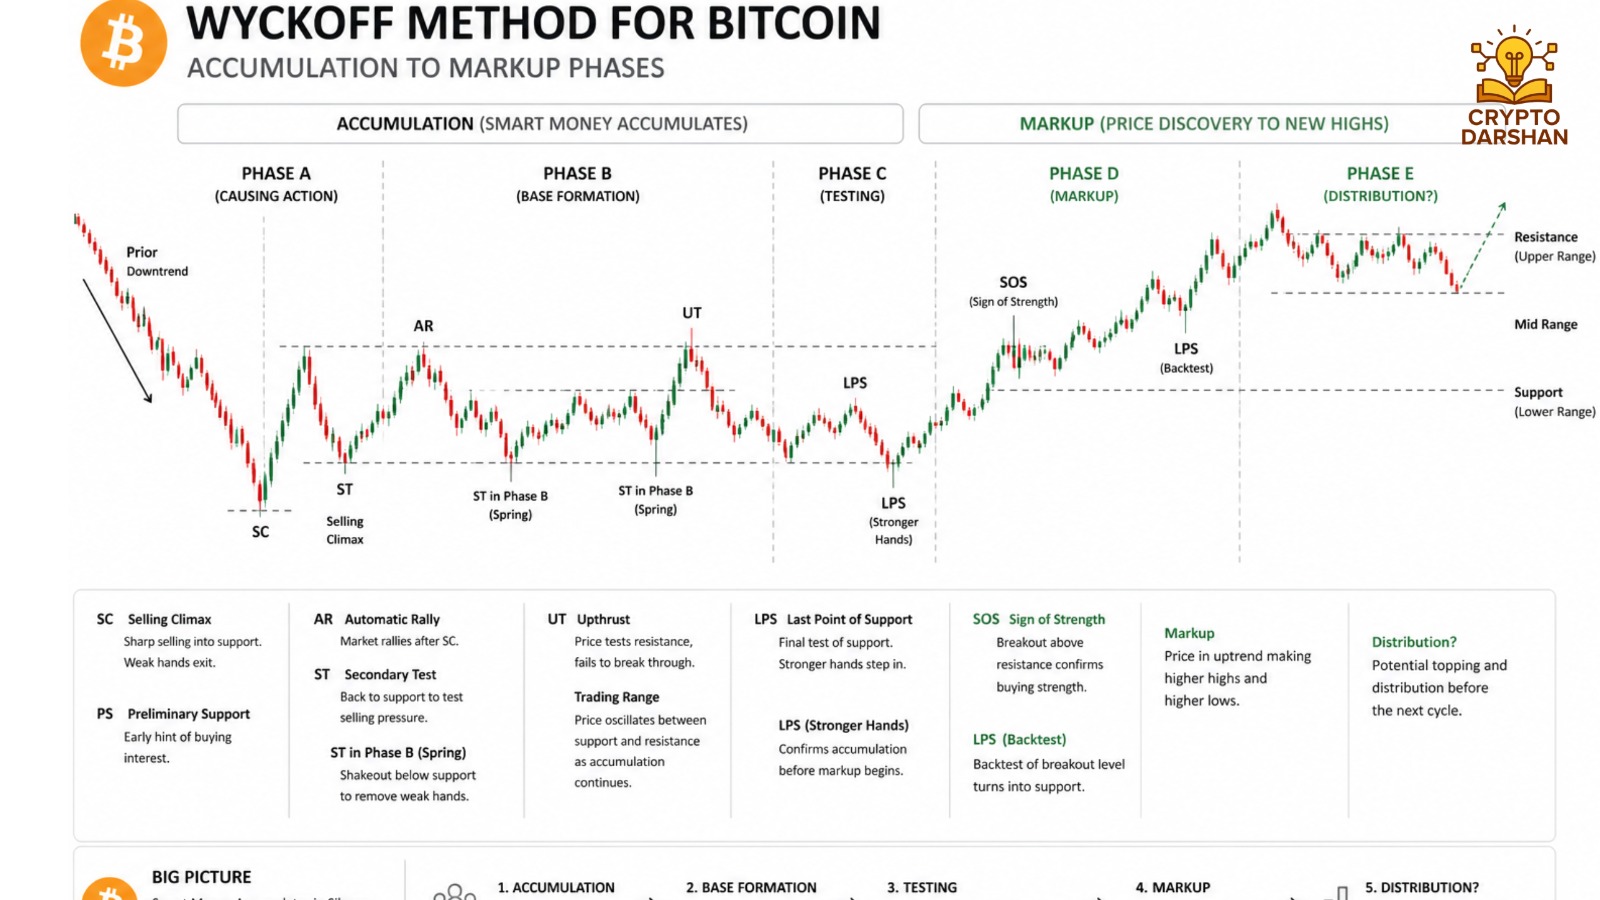
Key Events in the Accumulation Phase
- Preliminary Support (PS): The first sign of buying interest after a downtrend.
- Selling Climax (SC): A sharp decline followed by heavy buying, marking the end of the downtrend.
- Automatic Rally (AR): A rebound caused by short covering and initial demand.
- Secondary Test (ST): A retest of the support area to confirm the strength of demand.
- Spring or Shakeout: A false breakdown below support to trap sellers before a strong reversal.
- Sign of Strength (SOS): A breakout above resistance with increased volume.
- Last Point of Support (LPS): The final low before the markup phase begins.
Bitcoin Example
In Bitcoin’s history, accumulation phases have often occurred after major bear markets. For instance, after the 2018 crash, Bitcoin traded sideways between $3,000 and $4,000 for several months. This period represented institutional accumulation before the 2019 rally.
2. Markup Phase
The markup phase follows accumulation and represents the period of rising prices. During this phase, demand exceeds supply, and Bitcoin enters a strong uptrend. Retail traders begin to notice the rally, and optimism returns to the market.
Characteristics of the Markup Phase
- Higher highs and higher lows form consistently.
- Volume increases during rallies and decreases during pullbacks.
- Moving averages turn upward, confirming the trend.
- Market sentiment shifts from fear to optimism.
Key Events in the Markup Phase
- Breakout: Price breaks above the accumulation range with strong volume.
- Back-Up (BU): A retest of the breakout level to confirm support.
- Trend Continuation: Sustained upward movement as demand dominates.
- Climactic Run: A sharp price increase driven by euphoria and FOMO (fear of missing out).
Bitcoin Example
Bitcoin’s markup phases are often explosive due to its limited supply and speculative demand. The 2020–2021 bull run is a prime example, where Bitcoin surged from $10,000 to over $60,000 as institutional adoption increased.
3. Distribution Phase

The distribution phase occurs after a prolonged uptrend when the Composite Man begins selling into strength. Retail traders, driven by greed, continue buying, unaware that smart money is exiting the market.
Characteristics of the Distribution Phase
- Price moves sideways within a range.
- Volume increases on upswings and decreases on downswings.
- False breakouts (upthrusts) occur to trap buyers.
- Market sentiment is overly bullish.
Key Events in the Distribution Phase
- Preliminary Supply (PSY): The first sign of selling pressure after a strong uptrend.
- Buying Climax (BC): A sharp rally followed by heavy selling.
- Automatic Reaction (AR): A decline after the buying climax.
- Secondary Test (ST): A retest of the resistance area.
- Upthrust (UT): A false breakout above resistance.
- Sign of Weakness (SOW): A breakdown below support with increased volume.
- Last Point of Supply (LPSY): The final rally before the markdown phase begins.
Bitcoin Example
In early 2021, Bitcoin’s price action around $60,000–$65,000 displayed classic distribution characteristics. Volume spiked, price moved sideways, and false breakouts occurred before the market entered a downtrend.
4. Markdown Phase
The markdown phase is the period of declining prices following distribution. During this phase, supply overwhelms demand, and prices fall rapidly. Retail traders panic and sell at a loss, while smart money prepares for the next accumulation phase.
Characteristics of the Markdown Phase
- Lower highs and lower lows dominate.
- Volume increases during declines.
- Market sentiment turns bearish.
- Capitulation occurs as traders give up.
Bitcoin Example
Bitcoin’s markdown phases are often steep due to panic selling. The 2022 bear market, where Bitcoin dropped from $69,000 to below $20,000, exemplifies this phase. It set the stage for the next accumulation cycle.
Applying the Wyckoff Method to Bitcoin Trading

The Wyckoff Method provides a structured approach to analyzing Bitcoin’s price action. By identifying the current phase of the market cycle, traders can make more informed decisions about when to buy, hold, or sell.
Step 1: Identify the Market Phase
The first step is to determine whether Bitcoin is in accumulation, markup, distribution, or markdown. This can be done by analyzing price structure, volume, and market sentiment.
- Accumulation: Sideways movement after a downtrend.
- Markup: Strong uptrend with higher highs.
- Distribution: Sideways movement after an uptrend.
- Markdown: Strong downtrend with lower lows.
Step 2: Analyze Volume and Price Action
Volume analysis is crucial in the Wyckoff Method. Traders should look for divergences between price and volume to identify potential reversals. For example, if Bitcoin’s price rises but volume decreases, it may signal weakening demand.
Step 3: Use Support and Resistance Levels
Support and resistance levels help identify key areas where accumulation or distribution occurs. Breakouts above resistance often signal the start of a markup phase, while breakdowns below support indicate markdown.
Step 4: Confirm with Market Sentiment
Market sentiment provides additional confirmation. During accumulation, sentiment is bearish; during markup, it turns bullish; during distribution, it becomes euphoric; and during markdown, it shifts to fear.
Step 5: Plan Entry and Exit Points
Using the Wyckoff Method, traders can plan entries during the accumulation phase and exits during the distribution phase. This approach aligns with the actions of the Composite Man and increases the probability of success.
Wyckoff Schematics for Bitcoin

Wyckoff developed schematic diagrams to illustrate the typical price behavior during accumulation and distribution. These schematics help traders visualize the market structure and identify key turning points.
Accumulation Schematic
The accumulation schematic shows how smart money absorbs supply before a new uptrend. It includes phases A to E, each representing a stage in the accumulation process.
- Phase A: Selling pressure decreases; preliminary support and selling climax form.
- Phase B: The market builds a cause; price moves within a range.
- Phase C: A spring or shakeout occurs to trap sellers.
- Phase D: Price breaks above resistance; sign of strength appears.
- Phase E: Markup begins as demand dominates.
Distribution Schematic
The distribution schematic mirrors accumulation but in reverse. It shows how smart money distributes holdings before a downtrend.
- Phase A: Buying pressure decreases; preliminary supply and buying climax form.
- Phase B: The market builds a cause; price moves within a range.
- Phase C: An upthrust occurs to trap buyers.
- Phase D: Price breaks below support; sign of weakness appears.
- Phase E: Markdown begins as supply dominates.
Advantages of Using the Wyckoff Method for Bitcoin

- Market Structure Clarity: The Wyckoff Method helps traders understand Bitcoin’s market structure and identify key phases.
- Volume-Based Analysis: It integrates volume analysis, providing deeper insights into market strength.
- Institutional Insight: It reveals the actions of large investors, allowing traders to follow smart money.
- Risk Management: By identifying accumulation and distribution zones, traders can set precise stop-loss and take-profit levels.
- Adaptability: The method works across all timeframes, from intraday charts to long-term cycles.
Common Mistakes When Applying the Wyckoff Method

- Ignoring Volume: Volume is essential in confirming price movements. Ignoring it can lead to false signals.
- Misidentifying Phases: Confusing accumulation with distribution can result in poor trade timing.
- Overcomplicating Analysis: Simplicity is key. Focus on structure, volume, and sentiment.
- Lack of Patience: The Wyckoff Method requires waiting for confirmation before entering trades.
- Emotional Trading: Following emotions instead of the method’s principles often leads to losses.
Combining the Wyckoff Method with Other Tools

While the Wyckoff Method is powerful on its own, combining it with other technical tools can enhance accuracy.
1. Moving Averages
Moving averages help confirm trends during the markup and markdown phases. A crossover of short-term and long-term averages can signal trend changes.
2. Relative Strength Index (RSI)
RSI identifies overbought and oversold conditions. During accumulation, RSI often shows bullish divergence, while during distribution, it shows bearish divergence.
3. Fibonacci Retracement
Fibonacci levels help identify potential support and resistance zones within Wyckoff phases.
4. Volume Profile
Volume profile analysis complements the Wyckoff Method by showing where the most trading activity occurs, confirming accumulation or distribution zones.
Real-World Application: Bitcoin Case Study

2018–2019 Accumulation
After the 2018 bear market, Bitcoin formed a base around $3,000–$4,000. Volume decreased, and price moved sideways, indicating accumulation. A spring occurred in early 2019, followed by a breakout above $4,200, marking the start of the markup phase.
2020–2021 Markup
Bitcoin’s price surged from $10,000 to over $60,000 as institutional demand increased. Volume confirmed strong buying interest, and the trend followed the Wyckoff markup pattern.
2021 Distribution
Around $60,000–$65,000, Bitcoin entered a distribution phase. Volume spiked, and false breakouts occurred. The market eventually broke down, confirming the markdown phase.
2022 Markdown
Bitcoin’s price declined sharply to below $20,000, completing the markdown phase. This set the stage for a new accumulation cycle in 2023.
How to Trade Bitcoin Using the Wyckoff Method

- Identify the Phase: Determine whether Bitcoin is in accumulation, markup, distribution, or markdown.
- Wait for Confirmation: Look for signs of strength or weakness before entering trades.
- Enter During Accumulation: Buy near the last point of support after confirmation.
- Hold During Markup: Ride the trend while monitoring volume and sentiment.
- Exit During Distribution: Sell near the last point of supply before markdown begins.
- Avoid Trading During Markdown: Wait for the next accumulation phase to re-enter.
The Psychology Behind the Wyckoff Method

The Wyckoff Method is deeply rooted in market psychology. Each phase reflects the emotions of market participants:
- Accumulation: Fear and disbelief dominate.
- Markup: Optimism and confidence grow.
- Distribution: Greed and euphoria peak.
- Markdown: Panic and despair take over.
Understanding these emotions helps traders remain objective and align with the Composite Man’s strategy.
FAQ: Wyckoff Method for Bitcoin

1. What is the Wyckoff Method in Bitcoin trading?
The Wyckoff Method is a technical analysis framework that explains how large institutions accumulate and distribute assets like Bitcoin. It focuses on understanding market cycles through phases such as accumulation, markup, distribution, and markdown.
2. What are the main phases of the Wyckoff cycle?
The Wyckoff cycle consists of four key phases:
- Accumulation – Smart money quietly buys Bitcoin at lower prices
- Markup – Price trends upward as demand increases
- Distribution – Institutions sell to retail traders at higher prices
- Markdown – Price declines due to excess supply
3. What happens during the accumulation phase?
During accumulation, large investors (smart money) gradually buy Bitcoin while prices move sideways. This phase often includes events like:
- Selling Climax (SC)
- Automatic Rally (AR)
- Secondary Test (ST)
4. How can traders identify the markup phase?
The markup phase begins after accumulation when Bitcoin breaks out of a resistance level with strong volume. Key signs include:
- Higher highs and higher lows
- Increasing volume
- Strong bullish momentum
5. Why is the Wyckoff Method useful for Bitcoin trading?
The Wyckoff Method helps traders:
- Understand market manipulation by institutions
- Identify entry and exit points
- Avoid buying at market tops or selling at bottoms
6. Is the Wyckoff Method reliable in crypto markets?
While no method is 100% accurate, the Wyckoff Method works well in crypto because Bitcoin markets are heavily influenced by large players (whales), making accumulation and distribution patterns more visible.
7. Can beginners use the Wyckoff Method?
Yes, but beginners should start by learning basic price action and volume analysis first. The Wyckoff Method becomes easier to apply with practice and chart observation.
Conclusion
The Wyckoff Method remains one of the most effective frameworks for analyzing Bitcoin’s price movements. By focusing on supply and demand, volume, and market structure, traders can identify accumulation and markup phases with precision. This method not only reveals the actions of institutional investors but also provides a roadmap for navigating Bitcoin’s volatile market cycles.
From accumulation to markup, the Wyckoff Method empowers traders to think like professionals, anticipate market shifts, and make data-driven decisions. Whether analyzing short-term trends or long-term cycles, mastering the Wyckoff Method offers a strategic advantage in the ever-evolving world of Bitcoin trading.